May 22, 2019 March 28, 2023
The Hypergeometric Distribution
and Deckbuilding
Update 5/24/19: Added Multivariate Hypergeometric section
How many Stun Blocks should I put in my deck to increase my odds of having them turn one? Where should I put my Assassin’s Strikes in order to avoid pulling them all at once? How often can I expect to be able to use a Mana Burn turn one? All of these are questions that you’re likely to consider in some form while constructing your deck or power setup for Wizard101 or Pirate101. Much of the time, you’ll just go with what “feels” right, adjusting configurations based on in-match experiences. However, what if I told you there was a mathematical answer to all of these questions that doesn’t require advanced mathematical knowledge? Enter the Hypergeometric Distribution.
 I know, it’s a scary name, but stay with me for a second. The name is the only scary part. Let’s say you have a sample of “n” items (say, a 64 card Wizard101 deck). This sample of items has “y” number of desired items, or successes (for example, 6 tower shields) and “n-y” non-desired items, or failures (the other 58 cards in the main deck). You’re going to draw “x” items from this large collection (a 7 card opening hand, for instance). You want to know the odds of having “m” successes (2 tower shields) and “x-m” failures (say, drawing 2 tower shields and 5 other cards), assuming that each individual item in the large sample is equally likely to be drawn.
This is a sort of question that could be done by brute force multiplication of fractions. However, it would be incredibly tedious. Instead, we can use this Hypergeometric Distribution calculator to answer this question. I’ve included a more in-depth and mathematical explanation of this concept below. Reading it is not essential to understanding the rest of the article, although it is quite interesting if you’re a nerd like me.
Hypergeometric Distribution
Hypergeometric Distribution
The Hypergeometric Distribution is, at its core, a way to calculate the odds of an event happening WITHOUT replacement. What does this mean? Let’s say you were drawing playing cards from a 52 card deck. You pick one at random, write it down, and shuffle it back in. This means you can get the same result multiple times in a row. The number of possible outcomes is unchanged (you’ll always have 52 cards in the deck), meaning the odds of pulling any one card are always 1/52. This sort of experiment is called an event with replacement.
However, let’s say you were drawing cards from this same deck again. This time,once you pick a card you set it to the side and do not shuffle it back in the deck. This is an event without replacement. There are 52 possible outcomes when the experiment starts (as there are 52 cards in the deck). Once you pick the first card from the deck, the number of outcomes falls to 51, since that card is not being returned to the deck. This means that both Wizard101 and Pirate101’s card drawing mechanics are without replacement. Drawing a card puts that card in your hand. Consequently, that exact card cannot be drawn again (unless you have additional copies).
Since the Hypergeometric distribution answers questions about probability, we can use a basic formula to describe it:
Number of Successes/Total number of Outcomes
The last piece of necessary information is on combinations and permutations. Basically, a combination is an arrangement of items into a list, where the order of these items doesn’t matter. For instance, if you’re asked to pick 3 fruits from a collection of 5 with which to make a fruit salad, the order in which you pick the fruits is irrelevant to the construction of the salad. Picking (in order), grapes, apples, and bananas is the same as picking apples, bananas, and then grapes. However, let’s say you want to know the 3-digit combination of a safe. This time, there IS a difference between 123 and 321. The total number of possibilities can be described by using permutations, defined as an arrangement of objects where the order of the objects does matter.
- We denote combinations as nCk (you have n objects and are choosing k of them, order doesn’t matter)
- We denote permutations as nPk (you have n objects and are choosing k of them, order matters)
An Example
So, let’s consider the issue of drawing stun blocks in an opening hand in Wizard101. You have a 64 card deck, 5 stun blocks, and 59 other cards. (We can say that you have 5 successes and 59 failures) You’re drawing a 7 card opening hand and want exactly one stun block. Let’s think through how we can solve this problem (without using the hypergeometric calculator).
The first question: do we care about the order of this 7 card opening hand? The answer is no. It doesn’t matter if the stun block is the first card, or the seventh. It just needs to be present. Thus, we’re dealing with combinations throughout the entirety of this problem. Let’s return to our basic probability formula: Number of successes/total outcomes possible. How many outcomes are possible? We have a 64 card deck, from which we are choosing 7 cards. Since the order doesn’t matter this can be denoted as 64C7 (64 choose 7).
Now, how many successful outcomes are there? We have 5 stun blocks in the deck. One needs to be in our opening hand. It doesn’t matter if it’s the 1st, 2nd, 3rd, 4th, or 5th stun block. Thus, we can say that we have 5 items (the stun blocks), from which we need to choose one (any of the five). We denote this 5C1.
We’re not done though. We still have to take into account the other 6 cards in our opening hand. There are 59 (64-5) non-stun block cards in our deck. We have to choose 6 of them (7 card opening hand minus 1 stun block). Again, order doesn’t matter, so we denote it 59C6. We need 1 stun block AND 6 other cards. When we see the word “And” in a probability question, it denotes multiplication. Thus, we describe the number of successful outcomes as 5C1 * 59C6.
The Solution
Now plug in each of these values to our formula: Number of successes/total outcomes possible = (5C1 * 59C6)/64C7 . Any scientific or graphing calculator can evaluate this expression. We obtain: .362, or 36.2%. This means that you can expect to pull exactly one stun block in an opening hand a little over 1/3 of the time. As you’ll see below, this is the same result that we’ll get when using the online calculator.
Finally, here’s a direct formula for the Hypergeometric Distribution:
[yCm * (n-y)C(x-m)]/nCxWhere,
- n= population size
- x= quantity drawn
- y= number of success in the population
- m= desired number of success in the quantity drawn
- n-y= number of failures in the population
- x-m=desired number of failures in the quantity drawn
If you want to calculate the odds of pulling more than stun block, you would have to do separate calculations for m=1, 2, … and sum the individual probabilities.
The Calculator
In order to answer questions like the above examples, we’re going to go over to this site. When you arrive, your screen should look something like this
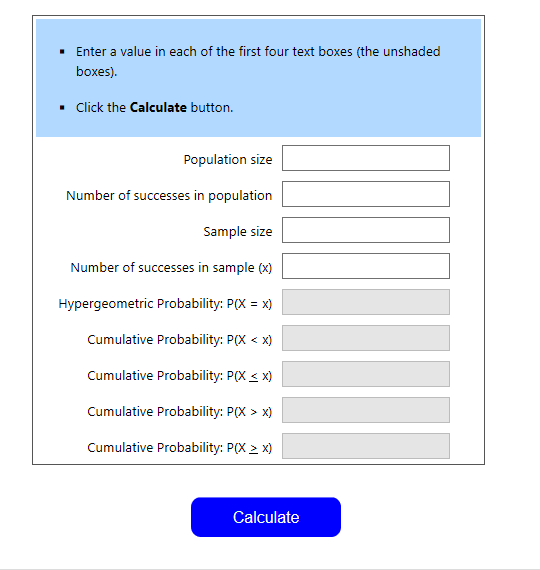
This may look overwhelming at first glance, but it’s really quite simple. Going line by line on the calculator
- Population Size – The population is the group from which you’re drawing cards. In these scenarios, it will be your main deck (generally of 64 cards in Wizard101 and varying by class on Pirate101) or your tc deck (input the number of tc you have in your deck)
- Number of Successes in Population – How many copies of the desired spell or power do you have remaining in your deck?
- Sample Size – Number of Draws you take. For an opening hand this is always 7 for both games
- Number of success in sample (x) – the number of success that you want in your hand. For instance, if you want 2 copies of a certain attack in your hand x=2
The Results
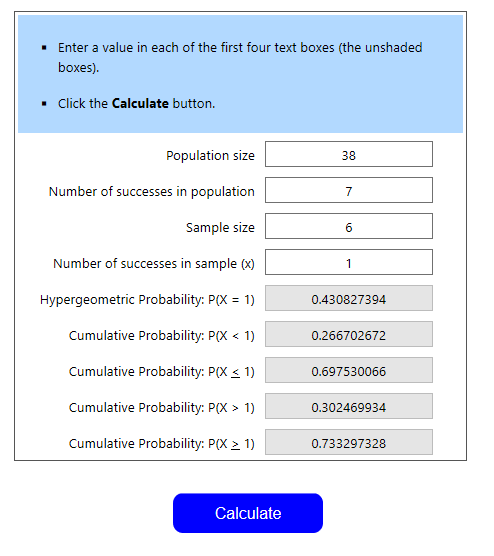
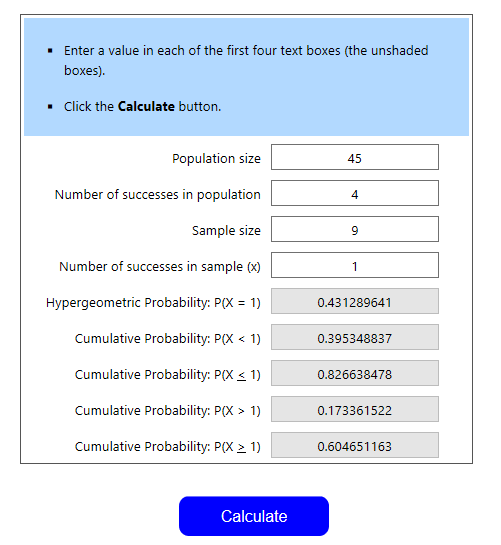
Let’s go to our question of stun blocks. You have a 64 card deck with 5 copies of stun block. You’re drawing a 7 card opening hand and want exactly one stun block. Our population size is 64, the number of successes is 5, the sample size is 7, and the number of successes is 1. We click “Calculate” and see this:
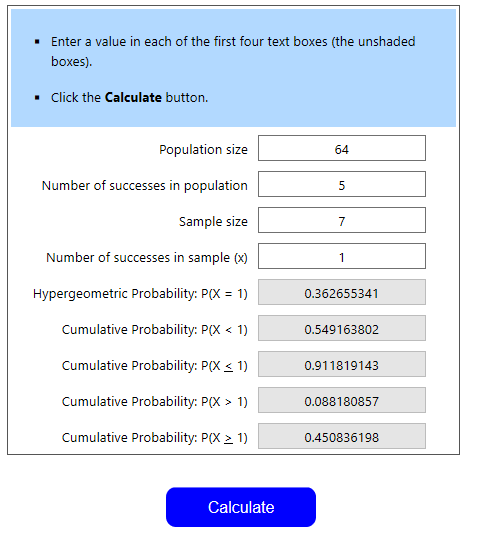
You’ll now see a bunch of decimal probabilities. Remember that a decimal multiplied by 100 equals the equivalent percent. I’ll go over what each one means:
- First line, Hypergeometric Probability: P(X=1) – This is the probability that you draw EXACTLY one stun block in your opening hand. In this case, it’s .3626, or 36.26%
- Second line, Cumulative Probability P(X < 1) – This is the probability that you draw LESS THAN one stun block in your opening hand (in this case, only 0)
- Third line, Cumulative Probability P (X ≤ 1) – This is the probability that you draw LESS THAN OR EQUAL TO one stun block in your opening hand (in this case 0 or 1)
- Fourth line, Cumulative Probability P(X > 1) – This is the probability that you draw GREATER THAN one stun block in your opening hand (in this case, 2, 3, 4, or 5)
- Fifth line, Cumulative Probability P(X≥1) – This is the probability that you draw GREATER THAN OR EQUAL TO one stun block in your opening hand (in this case, 1, 2, 3, 4, or 5)
More Examples
The best way to get a hang of this calculator is to see a variety of examples. I’ll feature a few from each game.
Example 1: The Fog Problem
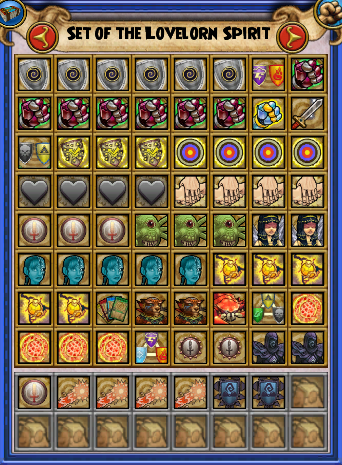
Let’s ask every swashbuckler’s favorite question: How often should we expect to pull Black Fog in our opening hand? However, we must address one problem: the power weighting system in Pirate101. The Hypergeometric Distribution requires that each individual outcome have an equal chance of occurring, so a weighted system classes with this requirement. Thus, we need to assume that powers in a certain range are equally likely to be pulled and the rest will not be pulled at all. In this case, let’s say the first 15 powers are equally likely to be pulled, and the remaining powers will not be pulled at all (this is somewhat close to reality, so we’ll get a good estimate). This is what the population (15 powers) looks like
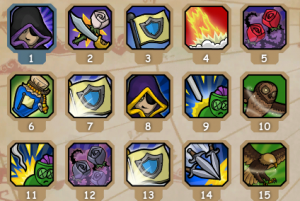
Black Fog is power #1, for those unfamiliar.
Let’s use the calculator
- Population size – 15 (we have a 0% chance of pulling the rest of our powers, so we only need to look at the first 15)
- Number of Successes in population – 1 (1 copy of Black Fog; we can change the question to ask about hides in general later on)
- Sample Size – 7 (Opening hands have 7 cards)
- Number of Successes in Sample – 1 (we want to pull our one copy of Fog)
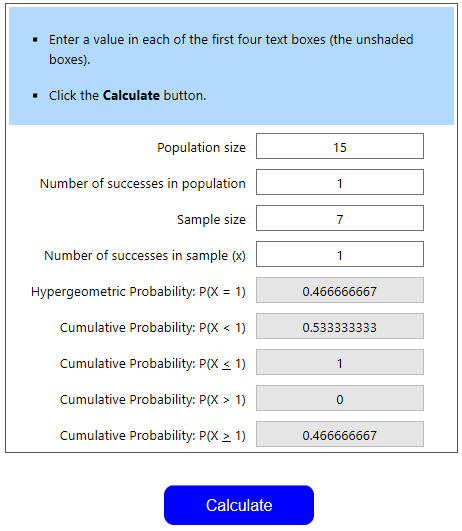
Thus, we see the odds of pulling Fog in our opening hand are about 47%. This seems lower than reality by 15% or so, but this provides a useful lower bound of the odds. If we change the requirement to be that we want to pull at least one hide (we have 2 in the first 15), we change “Number of Successes in population” to 2 and calculate again. We then look at “Cumulative Probability P(X≥1)” and see that we have a 73.3% chance of pulling at least one hide (or, greater than or equal to one hide). Again, this is a lower bound of the odds, so we can assume this number is slightly higher with weighted odds
Example 2: Don’t Get Triaged!
Hypergeometric probability can also influence decisions during matches. For instance, I’m a death wizard going second to a fire wizard. I plan on spending my first two rounds blading and then casting a Skeletal Dragon. My opponent has a sideboard of 35 cards, with 3 copies of triage. Each round, they will always pull 2 treasure cards from their sideboard. What are the odds that they will have the triage at their first opportunity to cast triage?
Let’s identify the relevant information:
- Population Size – 35 (we are only looking at the sideboard here)
- Number of Successes in Population – 3 (they have 3 copies of triage)
- Sample Size – 6 (This one is a bit tricky. You cast your dragon on round 2 going second, meaning their first chance to triage is round 3. They pull 2 treasure cards per round and have 3 rounds of drawing, meaning they will have drawn 6 tc by the time they cast a spell turn 3)
- Number of Successes in Sample – 1 (They only need one triage)
- Answer to look for: Cumulative Probability P(X≥1) – Our opponent needs AT LEAST one copy of Triage if they want to remove your DoT. We need to take in to account the fact that they may draw multiples. Thus, we need the probability of drawing greater than or equal to 1
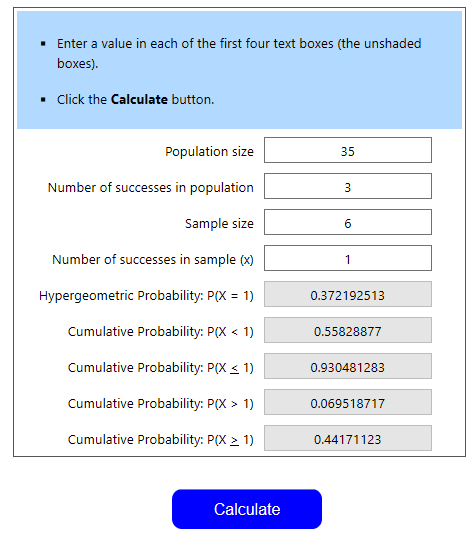
We see that the odds of our opponent having one or more triages available is 44.2%. Let’s say we were the fire wizard in this case. We’re constructing our sideboard and want to know the odds of pulling 2 triages in the first 3 rounds (6 pulls). This is P(X > 1), or 6.95%. I’d be pretty happy with these odds. Since the second triage this early is generally a dead drawing, we want these odds to be as low as possible.
However, it’s often impossible to know our opponents’ exact discarding patterns and tc deck compilation as mentioned above. It may be useful to re-calculate with a different sample size (larger numbers indicating more aggressive discards, smaller numbers indicating less aggressive discards) or with a different number of successes in the sample size to see how those numbers affect the opponent’s odds.
Knowing the (approximate) odds of an opponent drawing a powerful answer like Triage early on can help inform decisions both in match and during deckbuilding. For instance, if we had found that the odds of drawing that early Triage were well above 50%, a death PvP might decide to avoid attempting that play pattern or opt to devote fewer slots in their deck towards executing that combo.
Example 3: LOOOOOOOOOOOOOOOORE
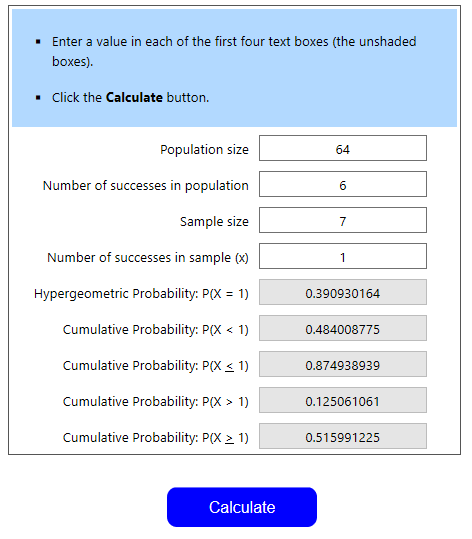
You’re a basic balance wizard; meaning you love you some early-game lore spam. You’ve built a deck with 6 copies of Loremaster in the main deck, and 7 copies in the side deck. The main deck has 64 cards and the side deck has 38 cards. You’re willing to discard 6 of your 7 cards in your opening hand to dig for a Loremaster TC, should you not have it in your opening hand. What are the odds of being able to cast a Loremaster on turn one, given that you always have the pips available to do so?
This example is very tricky. Let’s think it through. First, we need to find the odds of pulling a main deck Loremaster. This part is simple, as it’s nearly identical to our stun block example. The values that we’ll input to the hypergeometric calculator are (in order) 64, 6, 7, 1. We can denote this as HG(64, 6, 7, 1). Again, we need at least one Loremaster, so we want Cumulative Probability P(X≥1). This value is equal to 51.6%. This means that 48.4% of the time, we’ll draw no Loremasters and will then go to our sideboard to dig for one.
The Sideboard
We’ve identified that we’ll be looking through our sideboard in about 48.4% of matches. What percentage of these matches should we expect to find a loremaster? We have to use the calculator again. We’ve identified that our sideboard has 38 cards and 7 loremasters. We need at least one, given that we draw 6 cards. Thus, we can define the probability as HG(38, 7, 6, 1). Since we need at least one, we look at the P(X≥1)=73.3%
So, in 73.3% of the matches we look in the sideboard, we can expect to find a loremaster.
Adding the Results
We’ve found that in 51.6% of matches, we’ll find one or more Loremasters in the main deck. In the remaining 48.4%, we expect to find one or more Loremasters 73.3% of the time. Our odds of having a turn one Loremaster are describes as the odds of finding one in the main deck OR the sideboard.
An “Or” phrase in probability means adding, so we’re going to add main deck + side deck = total probability. Main deck = 51.6, that’s simple. However, the side deck= 48.4%*73.3%=35.47%. Why is this? We expect to pull a lore 73.3% of time from the side deck. We go to the side deck 48.4% of the time. Thus, we multiply these two numbers to find how often we successfully go to and find a lore in the side.
Therefore, 51.6%+35.47%=87.07%. That’s pretty consistent. If I were a lore-spammer, I’d be happy with those odds.
Example 4: Over-Charging
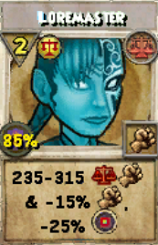
Let’s go back to Pirate101. You’re a buccaneer with the first three rows of your power setup that look something like this:
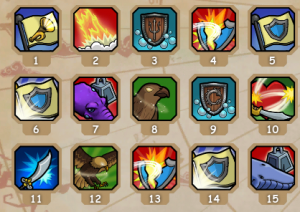
You hate having a cluttered hand of powers, so you want to know your odds of having fewer than 2 of your 50% shields in hand by turn 3. You’re not going to discard any powers, but you will use exactly one non-50% shield power for each of the first two turns. You assume that all 15 powers above are equally likely to be drawn.
For those who are unfamiliar, the 50% shields are in spots 6, 9, and 14.
Let’s Calculate
We have a population of 15 with 3 successes. Our sample size is 9 (7 card opening hand + 1 new power on turn 2 + 1 new power on turn 3). Finally, we have 2 successes desired in the sample. The hypergeometric expression is then HG(15, 3, 9, 2). Since we want fewer than 2 successes, we’re looking for P(X < 2). You may notice that we can also define P(X < 2) as P(X=0)+P(X=1). This provides an alternative method of calculation. Back to the main subject, the result looks like this:
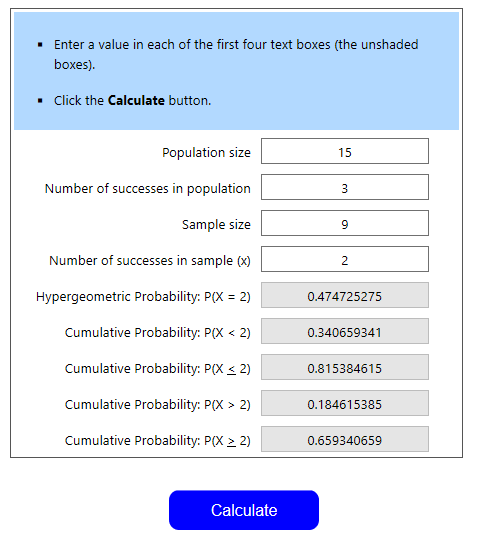
We see that the probability of having less than 2 of these buffs is 34%, meaning the probability of having 2 or more is 66%. This means that it’s fairly likely that you’ll have excess protection buffs sitting in your hand from an early point in the game. This could signal that you need to readjust, but maybe you prefer having extra shields on hand. This brings up an important point: These hypergeometric probabilities only give odds of an event happening. Given these odds, YOU have to make the decision about deck or power building. Are you okay with a 66% chance of having 2 large shields early on? Are you okay with an 87% chance of being able to use a lore turn one?
Example 5: Living on the Edge
You’re at low health against a swashbuckler opponent. You will die if they pull another guaranteed attack, but will not otherwise. They currently do not have a guaranteed attack in their hand, as they would have used it and killed you if they did. You know they have exactly 2 guaranteed attacks they haven’t drawn, since you’ve counted their powers closely. They have 12 powers remaining in their deck, each of which is equally like to be drawn and will draw 3 powers before you’re able to close out the match. Since discarding in Pirate101 is generally never particularly aggressive, you know the opponent won’t pull more than 3 powers. You’re super nervous; what are the odds of them not drawing the attack?
What are our 4 input numbers for the calculator?
- 12 powers in deck
- 2 are successes
- 3 draws remaining
- 1 attack needed to win
Thus, the expression is HG(12, 2, 3, 1) and the result looks like this:
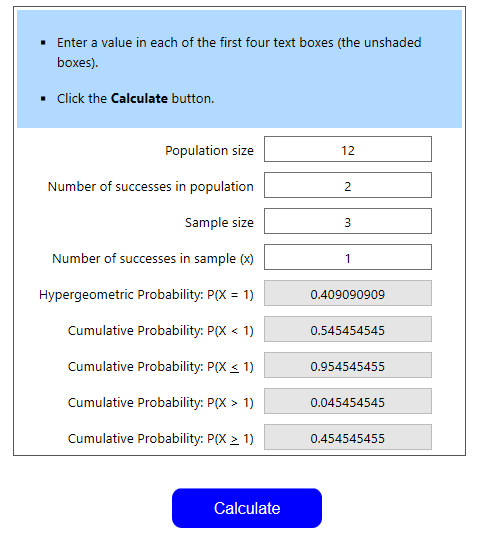
We see that the odds of pulling less than one attack is 54.5%. This means your odds of winning the match are 54.5%.
There’s another way to obtain these same results. Assuming the match cannot be a tie, it must end in a victory or defeat. We can say that P(victory)+P(defeat)=100%. P(X≥1)=45.5%, meaning your opponent will pull one or more attacks 45.5% of the time. This is P(defeat) Subtracting 45.5% from 100% gets us P(victory), or 54.5%, same as the above result.
Example 6: Bubbles!
I’m going to let you try this one. Your opponent currently has their bubble up. You want to change the bubble, but you have none in your hand. Your deck currently has 45 un-drawn cards, 4 of which are bubbles. You plan on casting one spell per turn and discarding 2 cards per turn. You’ll pull 0 cards from your side deck, meaning you’ll see 3 new cards per turn. What is the probability that you’ll see exactly one bubble after doing this process exactly 3 times? At least one bubble?
Tips: Identify each of the 4 input numbers
- Population size- How many cards are in my deck?
- Successes in population- How many are successes?
- Sample Size- How many cards will I draw?
- Successes in Sample- How many successes do I need?
You’ll find the answer below
Bubbles!- Solution
Bubbles! – Solution
Our expression for Hypergeometric probability is HG(45, 4, 9, 1). The deck has 45 cards remaining, with 4 successes. We’re drawing 3 cards a round for 3 rounds, seeing a total of 9 cards. The successes in sample is 1.
We see that our probability of pulling exactly one bubble is 43.1%, or P(X=1). The probability of pulling one or more bubbles is 60.5%, so the probability of pulling none is 100%-60.5%, or 39.5%. We can also find the probability of pulling none by looking at P(X < 1)
Multivariate Hypergeometric Distribution
The above examples all essentially answer the same question: What are my odds of drawing a single card at a given point in a match? However, this isn’t the only sort of question you could want to ask while constructing your deck or power setup.
For instance, what if you wanted to calculate the odds of drawing at least one Loremaster and one Enchant for that Loremaster in your opening hand, given 7 copies of each spell in a 64 card deck? Your initial instinct may be to just calculate the individual probabilities for at least one Lore and at least one Enchant and multiply them together. However, this isn’t the case. These two events aren’t independent, so multiplying isn’t going to yield the proper result (this can be easily verified by realizing that “at least one lore” and “at least one enchant”‘s probabilities include drawing 7 copies of each spell, which cannot happen).
To solve this and similar questions, we’ll need to use the Multivariate Hypergeometric Distribution (since we have 2+ variables). In the next section, I’ll explain the actual math, like I did with the single variable hypergeometric distribution. However, you can skip this section and go to the explanation of how the calculator itself works.
Multivariate Math
Multivariate Math
Alright, so we’ve verified that we can’t simply multiply the single hypergeometric probabilities to yield the multivariate probability. To find the correct method and answer the above question, we’ll look at a simpler question first: What is the probability of drawing exactly one loremaster and exactly one enchant in your opening hand. We’ll assume that the deck size is 64 and that you have 7 copies of each of the aforementioned spells. Like with the single variable problem, we can describe the solution very generally as:
Number of Successes/Total number of Outcomes
Like we did with the single variable problem, we’ll still use combinations to describe both parts of this fraction (see the first math section for an explanation). The total number of outcomes is 64C7, just like before. We’re still drawing 7 cards from a 64 card pile, and the order is irrelevant.
What about the top? The number of successes can be described as the number of ways we can draw one loremaster AND the number of ways we can draw one enchant AND the number of ways we can draw five other cards. Once again, the “and” in this problem denotes multiplication. So, the number of ways to draw this grouping is the 7C1 (7 lores in deck, we want to draw any one of them), multiplied by 7C1 (7 enchants, draw any one), multiplied by 50C5 (64-(7+7)=50 cards remaining in deck, draw any 5 of them). In conclusion, the odds are (7C1*7C1*50C5)/64C7 = 16.7%.
Now to answer the question initially posed: what are the odds of drawing at least one lore and enchant, given the same information as before. First, find a formula using the variables L and E (lore and enchant) that describes the odds of drawing any amount of lores or enchants in an opening hand. The denominator of the formula stays the same, 64C7. The first term of the top becomes 7CL (7 lores in deck, we want to choose “L” number of them). The second term becomes 7CE (using the same argumentation).
The third term is where things are a bit more interesting. The sum of L+E+(other) must equal 7, the size of our opening hand. We don’t want to introduce a new variable, so we can describe this (other) as 7-L-E. Thus, the third term becomes 7C(7-L-E). The overall formula is then (7CL*7CE*7C(7-L-E))/64C7.
To calculate the odds of drawing at least one lore and enchant, we’ll have to use sigma notation. In the single variable problem, solving the odds of drawing at least 1 lore meant summing the formula from L=1 to 7 (the maximum amount of Loremasters drawable).
In this case, we have two variables, so we’ll have to use a double sum (two sigma symbols next to each other). We’ll be summing this expression: (7CL*7CE*7C(7-L-E))/64C7. Our two variables are L and E. All we have to do now is calculate the upper and lower bounds of each sigma. Let’s start with L. The lower bound of L is L=1. The upper bound is no longer 7, it’s now 6 (if we draw 7 lores, we can’t draw an enchant, thus the max we can draw all while being able to draw one enchant is 6). So, we’re summing L from 1 to 6
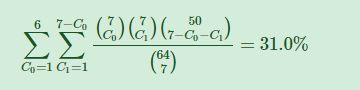
What about E? The lower bound is still E=1. The upper bound is a bit trickier. We can’t sum it from 1 to 6, or else we’d have a situation where we’re drawing 6 of each spell. This is obviously impossible. Thus, we have to describe the upper bound of E as a function of L (this is another way of verifying the variables’ lack of independence). So, if we’re drawing L amount of loremasters, what’s the maximum amount of enchants we can draw? Our maximum hand size (7), minus the amount of lores drawn (L). Thus, the upper bound is 7-L. So the overall solution to our question looks like this (C0 represents L and C1 represents E)
Similar logic can apply to questions of 3, 4, etc. numbers of variables. Generally speaking, we’ll want to divide our population (the deck in this case) into n+1 groups, where n is the amount of variables (success #1, success #2, success #3, failures). In the above case, we had 3 groups. If we, say, added shields to the equation, we’d have 4 groups (lores, shields, enchants, and other cards/failures).
The sigma notation also follows a simple logic. Each variable needs its own sigma, and the lower bound will always be the minimum amount of cards we want to draw from that sample (normally 1). The upper bound for the first sigma will be the highest number possible, such that you can still draw the minimum from all the other variables. The upper bounds for the following variables will be a function of any previous variables. It will be the total amount of cards drawn, minus any previous variables. So, in the case of lores, enchants, and shields, the upper bound for lore is 6, for enchants 7-L, and for shields 7-L-E. (If you have questions, feel free to ask in the comments or in our Discord. This is complex stuff)
The Multivariate Calculator
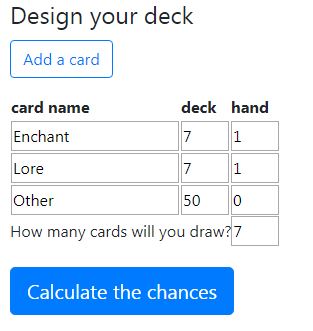
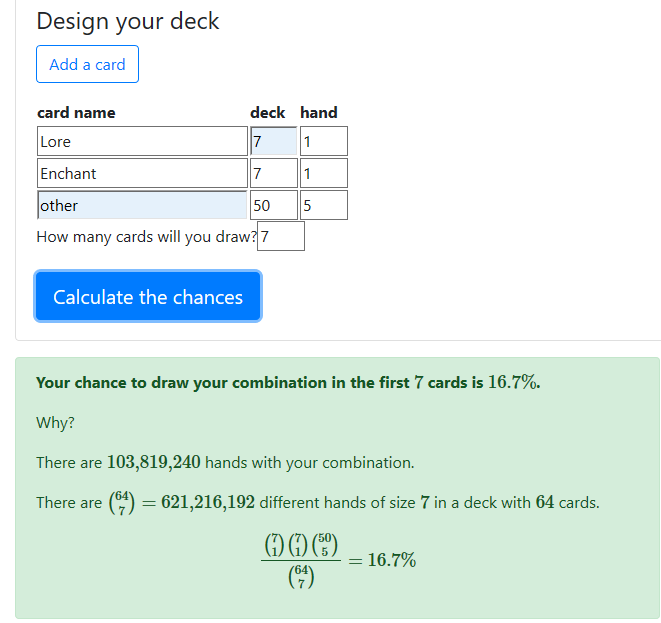
Unlike the math, which, if you read it, was very complex, the calculator is really easy to use and not complicated. The first column, card name, is fairly self-explanatory. You’ll have categories for each type of “success” and one “other” category, representing failures. For instance, in the above example, we have Enchants, Loremasters, and “Other.” If we wanted to add a third variable, say shields, our columns would be Enchants, Loremasters, Shields, and “Other.” Click “add a card” if you want to add an additional variable. NOTE: Other should always be your bottommost row, to avoid formatting issues.
The second column, deck, represents the total number of cards of that type in your deck. In the above example, we have 7 lores and 7 enchants available in our deck. Our deck is 64 cards, so the number of “Other” cards is 64-7-7, or 50. The numbers in the second column should ALWAYS sum to the total deck size, or else you’ve made a mistake.
The final column, hand, represents the minimum amount of each card we want in our hand. In this case, we want 1 lore and 1 enchant at minimum, so we put 1 and 1 in the first two boxes. We don’t care about the number of “other” cards in our hand, so that number is 0 (this means that we’re ok with drawing only lores and enchants in our opening hand). Finally, How many cards will you draw? is exactly what it sounds like. For questions of opening hands, the number is 7. We’ll see that the result looks like this:
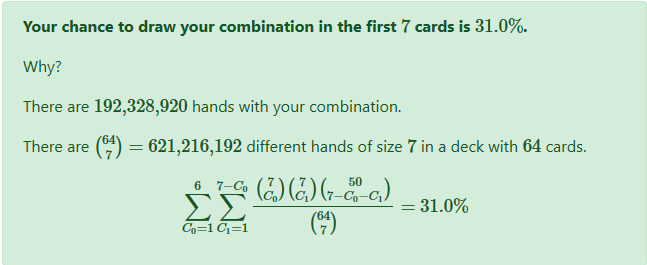
So, we have a 31% chance of drawing at least one lore and one enchant in this scenario. (For those that read the math section, the sum shown is the same that we arrived at thinking it through). If we want to calculate the odds of drawing exactly 1 of each, we’d change the “other” and “hand” entry from 0 to 5. This would calculate the odds of drawing “at least” one lore, one enchant, and five other cards in a sample of seven drawn cards. You can’t draw more than one, one, and five, respectively, without changing the amount of cards drawn, so this calculates the odds of drawing exactly one lore and one enchant. The answer, which we verified in the math section, is 16.7% .
Deck Building Decisions
How can this concept be applied to deck building in Wizard101 and power setup ordering in Pirate101? Let’s look at some things that hypergeometric probability can help inform.
Wizard101
- Deck Size (both main and side)– This is the first question that you should be asking yourself while constructing a deck. Although other factors need to be accounted for in deciding this (such as the prevalence of ultra-defensive strategies, which may warrant larger deck setups), calculating the hypergeometric probability of pulling certain cards in a given amount of time can help you decide if you prefer a smaller or larger deck. For instance, the odds of pulling a stun block in your opening hand with a 32 card deck and 2 copies of the spell are slightly better than the odds of pulling a stun block in your opening hand with a 64 card deck and 4 copies of the spell. You can also run trials to decide whether it would be better to concentrate your attacks completely in the side or main, or have the traditional split between the two. You may find that your odds of pulling the relevant attack are increased should you run your attacks completely in the side deck
- Spell Count/Quantity– This is something that was generally done by what “felt right.” However, you can now use math to make the decision. You can, for instance, calculate the odds of having an overflowing amount of shields in your opening hand, or slightly thereafter (you’d just need to know generally how many extra main deck cards you see per turn). Maybe you have 60%+ odds of pulling more than 5 shields in the first 14 cards you see. This is possibly undesirable, so you may reduce your numbers accordingly. You can do the same with blades, auras, shrike, heals, etc. In addition, you can calculate the likelihood of seeing your deck’s 1 or 2 of’s by a certain point. Maybe you run two balance dispels and want to know how many draws it will take to have an over 50% chance of seeing at least one of them. This can inform your gameplay decisions if you know that you need to discard more aggressively to increase your odds of seeing these silver-bullet answers
Pirate101
- Power concentration– Oftentimes I’ll see power setups that have all of their protection buffs,oftentimes 3-5 of them, in the first 2 rows. Since you don’t want to have a bunch stuck in your hand at once (they’re too valuable to discard, but since each one lasts 5 rounds, you won’t be using them all in a rapid manner) it’s worthwhile to calculate the odds of puling multiples in your opening hand, or after say, 9-10 powers seen. However, since power setups are weighted, you have to make assumptions that the first n powers are equally likely to be drawn. I generally used 15, since it seemed somewhat close to reality. You can run additional trials with populations of say, 10-12 or 17-19 (meaning that you decided that you want to assume that the first 10-12 or 17-19 powers are equally likely to be drawn) to see how that changes your odds.
- Number of Powers from Gear- Deciding how many copies of a certain power should be on your gear can be tricky, especially if you’re trying to create a gear set yourself (maybe it’s for a tournament with specific rules). I sometimes see players, especially buccaneers, that are maxing out on attacks from Moo Tower gear. They often have 3-4 extra Vicious Charges and equally many Super Strikes from gear. They could use this calculator to see that they’re very likely to constantly have a hand clogged with these attacks, since their number of successes in the population is extremely high relative to the population size. Thus, they should change gear.
A Word of Caution
Now that you have a general idea of how this calculator works and how powerful of a tool it can be, hopefully you’re interested in using it to optimize your decks or power setups. However, there are a few things that you need to keep in mind:
- Some powers are great to have early on, but get significantly worse in multiples or later in a match. A prime example is Stun Block. Running a lot certainly increases your odds of pulling one early, but that second stun block is generally a dead draw.
- Know how aggressively you can discard or cycle your cards/powers. The more cards you see, the more likely you are to see a card that you need. Thus, you can afford to include fewer of a key card should you be willing to cycle aggressively. However, this isn’t possible in Pirate101. Training a power or getting it on a piece of gear only gives you one copy of it. This means that each individual power is high-value, and aggressively discarding them leads to a waste of resources. Thus, an effective power setup is very important
- Remember, this analysis is what we can call a “positive” analysis. It merely describes how often something will happen. It says nothing about what should happen. This means that you, the deckbuilder, have to decide how to interpret each probability. This process doesn’t necessarily make deckbuilding an exact science. It merely eliminates the guess and check work that we would traditionally have to do. For example, you still have to decide, based on probabilities, how many loremasters is enough. Is having one by the time you want it 80% of the time enough for you? Is it too often, not often enough? The ultimate decision, a normative one (stating what you want to happen) is up to you.
At the end of the day, the hypergeometric distribution is only a method of obtaining probabilities (albeit an incredibly potent and useful one). Sometimes, unlikely events happen. You’ll occasionally pull 3 stun blocks in an opening hand. You’ll occasionally get no hides in your first 12 draws. That’s just how RNG works. These events are all still random. However, knowing the odds of an event happening allows you to anticipate its happening and plan how to play around it.